Here are the Instruction Goals (from the Teacher's Notes) that we worked on:
- Reference frame, position and trajectory
- Choose origin and positive direction for a system.
- Distinguish between vectorial and scalar concepts (displacement vs. distance, velocity vs. speed)
- Particle Model
- Derive relationships from position vs. time graphs (displacement, average velocity, and position equations)
- Multiple representations of behavior
- Introduce use of motion maps and vectors.
- Relate graphical algebraic and diagrammatic representations.
- Dimensions and units
- Use appropriate units for kinematical properties.
- Dimensional analysis
Model Development
Our introduction to Unit 2 was similar to the introduction to Unit 1, but before we made observations, Laura led us through defining important terms. She started by defining a reference point, walking a certain number of tiles to the right and asking us to describe what she had done. Through lots of walking and some specific questions, we developed working definitions for position (where you are; the distance from a certain place), distance (linear space between two points), and displacement (you far you end up from where you started, with direction). We did go back and re-define distance to be the total space (length) of the path you traveled. (We were trying to avoid length, because that could be considered a synonym of distance.) I really wish I'd been writing down the questions she asked, so I could get a sense of her wording. (I'll likely ask things like "How do you describe where I am now?" and "How do you describe what I walked?") Laura suggested that we put some space between this activity and the next one, so that students have time to let these definitions sit with them before moving on. I think that sounds like good advice.
The first lab started with us making observations about a tumble buggy. We started with just what we observed, then talked about what we could measure, and finally what we could change. When speed was mentioned, Bryan paused and asked us what speed was. Our definition was how much distance we could cover in a certain amount of time. More distance meant a higher speed, and less distance meant a lower speed. It's good that he did, because speed showed up a lot in the "What can we change?" column.

Once we'd finished discussing what we could change and what effect that might have, we were asked to see if there was a relationship between the time and the position of the car. This led to a discussion of how we could measure each of those, and we developed two methods. First, we could note the time the buggy took to travel to certain positions (time at 1 m, 2 m, 3 m, etc.) by using the lap button on our stopwatches (phones). Second, we could note the position of the car at certain times (position at 2 s, 4 s, 6 s, etc.) by placing sticky notes at the correct location. Both methods work, but our graphs would technically have different variables on the x-axis, depending on the method we used. For the sake of consistency, Laura asked us to all put time on the x-axis.
We also did this lab in 2 parts. In Part 1, we all had similar cars, and they all started at the reference point. In Part 2, Laura assigned different scenarios, changing the starting position, changing the buggy, changing the direction of the car, or some combination of those things. This was a beautiful way to give us similarities and differences, and allow us to puzzle out how the graph and equations were affected by each change.
Check these out:


I loved the variety of the whiteboards that came out of this. I'm sad that with the small class size I have, I won't be able to have that much variety. We may have to do a Part 3 to the lab, where I assign scenarios we didn't have the manpower for in Part 2.
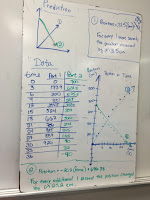
From our discussion about what we changed in Part 2 and what features of the graph were affected, we could determine the parts of the linear equations were affected by those same changes. This meant that we could generalize our equation. (See the picture below.)

Since I'm separating this entry into Model Development and Model Deployment sections, this is where I'll draw the line. There's still development to be done, but we also started using what we'd developed already in new situations.
Model Deployment
The deployment phase started with a worksheet on reading position vs. time graphs that compared the motion of two objects. Each group was then assigned a couple of the questions to whiteboard so that we could have a discussion about our answers. I've used this worksheet before, checking the answers by having different students share their answers, but then I would tell them if they were right or wrong, giving the correct answer if they were wrong. Sometimes, someone would ask a question about why the answer was what it was, but usually not. I've never let the students discuss the way we discussed the answers. I've never questioned their explanations more closely to see if they really understood what they wrote down. I will be this year! This discussion really reinforced what we had talked about in the model development phase, allowing for clarification and refinement.
Our next activity was actually more development of the model. Laura used one of the worksheets to guide us through some whiteboarding on velocity vs. time graphs. She let us know that she knew this was our first time drawing these graphs, and emphasized she wanted to see what we thought the graph should look like. So she posed a situation, and asked us to sketch the graph. Then we shared our graphs and compared them. There were some interesting issues that come up, like the way we show direction on the graphs, and whether or not you can determine position (or where the reference point is) from a v vs. t graph. It was a great conversation where it was OK to be wrong. This is definitely one of the early culture building conversations. Yes, it's in Unit 2, but that will still be early enough in the course to be establishing a safe and constructive culture. This discussion also led us to finding displacement (not position) from the area under the curve. I may need to use this in my Calculus class to introduce integrals as accumulated change and the connection to area on the graph.

The last piece of the model we developed was the idea of a motion map. Bryan had us watch one of the buggies move across a table, opening and closing our eyes so that we would see "snapshots" of it's movement. Then we drew what we saw, eventually reducing the pictures of the buggy down to a dot. While we didn't set all of the conventions for a motion map at this time, we certainly understood the general idea of what a motion map showed us.
We used a few more worksheets to keep deploying the model, including one that had us creating different representations for the same situation. For example, we'd be given the x vs. t graph, then asked to sketch the v vs. t graph and the motion map, and write a verbal description. Or we'd be given the v vs. t graph and asked to draw the other three representations. My students would hate it after about two problems, but it would be oh-so-good for them in terms of helping them build connections between the representations!
We wrapped up this unit with the Buggy Practicum. I loved this!
My question is, when do I start assessing students on content? (I think assessing them on their lab and justification skills can start right away in Unit 2 - they've already had some practice.) If I start assessing their understanding of the concept too soon, it will inhibit their willingness to run the risk of being wrong. What is the best vehicle for the assessment? Do I grade the deployment worksheets? Do I just give little quizzes all along to see where they're at? Actually, that last idea sounds the best. I don't want to grade homework, because it's for practice. And because I use standards based grading, short quizzes that spiral would let them track how their understanding of the model grew. Maybe the first one comes after the first bit of deployment?
All formative all the time. That's my motto. Let's stop grading and start feedbacking. Yes I just made that word up and that's what's wrong with education. Feedbacking is not a word. It should be. (Sorry I'm just kinda tired today. I was up late last night feedbacking papers.)
ReplyDeleteIt's a word now! Let's start a movement. If enough people start using it, it'll end up in the dictionary like Yooper and YOLO. (Except it will be under the Fs, not the Ys.)
DeleteI'm really trying to figure out how much how and when I assess students impacts the culture of growth. How can I get my assessments to encourage that culture, rather than subtly reinforcing the traditional mindset? Is it not about the how and when, but about my attitude toward them?
Policing myself and my habits is going to be the hardest part about building the culture. I think there's a lot I do that still supports the traditional paradigm. I'm hoping that switching to Modeling is going to help me be more consistent with the messages I'm sending students.